Lighting Design
Designing a basic lighting scheme requires the consideration of many factors, not just the achievement of a desired lighting level.
Basic objectives must first be established, such as:
• What sort of tasks will be performed in
the area?
• What 'mood' needs to be created?
• What type of lighting will create a
comfortable environment?
There are also standards and legislation that
need to be complied with. For example:
• How energy efficient must the
lighting be?
• How will Building Regulations affect the
design?
• Is emergency lighting required?
When all of these objectives and requirements have been established, they can be expressed as a series of lighting criteria in order to facilitate a quality lighting design. Criteria that would normally be considered are:
Level of Illumination
Illumination levels for a wide variety of environments and tasks can be found in BS EN 12464-1: 2011 and the Society of Light and Lighting's Code for Lighting.
The levels stated are maintained illuminance, which is the minimum average illumination level that should be achieved at the point of scheduled maintenance.
Uniformity and Ratios of Illuminance
The combination of luminaires selected should evenly illuminate the working plane and appropriately illuminate walls and ceilings in relation to the task illumination, so that a pleasant and comfortable environment is achieved. In specific areas, increased directional lighting may be required to create a defined or more intimate environment.
Glare
The acceptable level of glare should be established as appropriate for the application, using information in BS EN 12464-1: 2011 and the SLL Code for Lighting.
Colour and Room Reflectance
The colour appearance of the lamps should be chosen for the application and complement the interior colour scheme, which should be chosen with an appreciation of the reflectance values that will be achieved. Lamps should be selected with appropriate colour rendition properties as detailed in EN12464-1 and for colour discrimination and reduction of eye fatigue.
Energy Efficiency
Luminaires should be selected that meet the requirements of the Building Regulations Part L. The distribution characteristics should also match the requirements of the criteria above.
Special Considerations
Certain applications require additional considerations, such as the addition of display lighting, the arduous nature of the environment or the use of Display Screen Equipment. Luminaires should be selected and the design completed with these elements in mind, where appropriate.
After these criteria have all been considered, a lighting scheme calculation can be undertaken. The most popular method of establishing the quantity of luminaires required, the illumination level achieved and the luminaire layout, is to use computer software created specifically for lighting design. It is important to remember that all the criteria above must still be considered prior to using computer software, if a satisfactory scheme is to be produced.
Lighting design can also be achieved using published photometric data, such as that included on the product pages of this guide. Average illumination via the lumen method of calculation can provide fast results that can then be assessed and facilitate more detailed design of the most appropriate option if required.
Lumen Method Calculations
This method uses the utilisation factor tables created from photometric measurement of each luminaire. Firstly, the Room Index (K) of the space must be calculated, which is the relationship and measure of the proportions of the room:
K = L x W / (L + W) x Hm
Where:
L = length of room
W = width of room
Hm = height of luminaire above working plane
The result is used in conjunction with room reflectance values to obtain a specific utilisation factor for the surface illuminated from the tables.
This can then be used as part of the calculation to determine the average illuminance level, using the following formula:
E = F x n x N x MF x UF / A
Where:
E = average luminance
F = initial lamp lumens
n = number of lamps in each luminaire
N = number of luminaires
MF = maintenance factor
UF = utilisation factor
A = area
The maintenance factor is a multiple of factors and is determined as follows:
MF = LLMF x LSF x LMF x RSMF
Where:
LLMF = lamp lumen maintenance factor - the reduction in lumen output after specific burning hours
LSF = lamp survival factor - the percentage of lamp failures after specific burning hours
LMF = luminaire maintenance factor - the reduction in light output due to dirt deposition on or in the luminaire
RSMF = room surface maintenance factor - the reduction in reflectance due to dirt deposition in the room surfaces
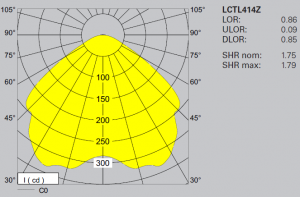
Polar Intensity Curves
This illustrates the distribution of luminous
intensity, in cd/1000 lm, for the transverse
(solid line) and axial (dashed line) planes of
the luminaire. The curve provides a visual
guide to the type of distribution expected
from the luminaire e.g. wide, narrow, direct,
indirect etc, in addition to intensity.
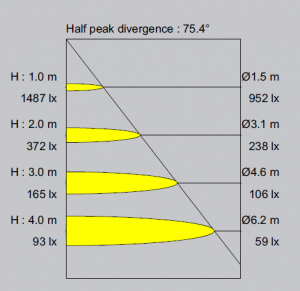
Illuminance Cone Diagrams
Usually used for spotlights or lamps with
reflectors, the diagram indicates the
maximum illuminance, E lux, at different
distances, plus the beam angle of the lamp
over which the luminous intensity drops to
50%. The beam diameter at 50% peak
intensity, relative to distance away, is also
shown.
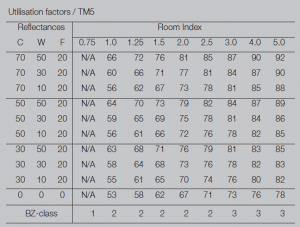
Utilisation Factors Chart
Utilisation factors show the proportion of
the luminous flux from the lamp that
reaches the working plan. This is for the
specific luminaire and allows for surface
reflectivity and Room Index. The UF is used
in average lumen calculations to calculate
the average illumination level for an area
with a specific luminaire.
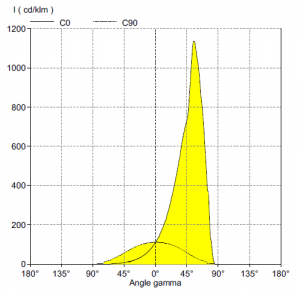
Cartesian Diagrams
Generally used for floodlights, this indicates
the distribution of luminous intensity, in
cd/1000 lm, for the horizontal (solid line)
and vertical (dashed line) planes of the
luminaire. The diagram provides a visual
guide to the type of distribution expected
from the luminaire e.g. narrow or wide
beam etc, in addition to intensity. The
associated data illustrates the beam angle
to 10% peak intensity.
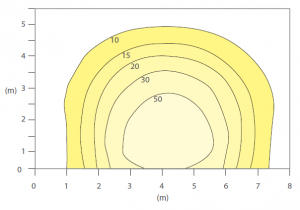
Isolux Diagram
The contours provide the points of equal
illuminance, in lux, on the floor or wall
plane, from a specific stated mounting
position. The diagram can be used to
assess the distribution characteristics of the
luminaire in addition to determining lighting
levels.